

… It’s what I used to tell developers asking how to choose which strategies to keep, cut, or size up — a blunt instruction, meant to unsettle. And it did. Next, I could read their thoughts:
“Past returns are not indicative of future performance?...”
“No, that phrase is only really about liability”, the mindreader smiled.
I am talking about something different.
The characteristics of a strategy and the outcomes of a strategy are not the same. The counterparty it normally matches with, the flow and volatility it feeds on, the market constraints it exploits, even the way it misses the prediction — those are characteristics. Often meaningful ones. The equity curve, and most of its descriptors, are an outcome. A few P&L-metrics reach over into characteristics — Sharpe, Sortino, MaxDD and so on — and those can earn their keep. But as long as they depend on the P&L, they are a supporting act in a play where the market prima donna takes center stage.
Deconstructing your strategy results
The strategy outcomes — the P&L and its derivatives — are made up of edge plus noise, plus regime, plus luck. The sum produces the number you are measuring. The decomposition is immensely difficult.
Decomposing noise from the market itself is hard. In a strategy result, more so.
Regime? If you have tried defining regimes in your strategies, I bet the memory alone brings cold sweat. As the saying goes: “I have the perfect mean reversion system, and a stellar trend follower. I just don’t know when to switch.”
Luck is what is left after you discard the rest.
So the job is to focus on the edge. Still extremely elusive — we mostly don’t even try to quantify it precisely, but ask: is there any? Is there enough?
Does your strategy actually have an edge?
And that is directly related to the question of WHY your strategy works. Because institutions unwind their positions around the close of the week? Because the spot market moves gold overnight? Because there is excess volatility around NFP?
And then another measure that doesn’t get enough prime time: WHEN. What are the market conditions when your strategy capitalizes? When liquidity is flowing in but the price is whipsawing? Or when things calm down and it trends up?
We don’t answer these questions to put together a prospectus, or to explain away our responsibility for not beating the S&P 500 this quarter. It is very, very pragmatic. It is to know the conditions under which it may stop working. To understand the reasons those conditions change. And to look for measures that set off the alarm before the gates are shattered and the enemy is already inside — counting your money. Ed Thorp set this bar decades ago: you have an edge when you can explain why it exists — and how you will lose it1. The why and the when.
What do we use, if not returns?
The developer’s question, and a fair one. Let me list a few that survived my twenty-five years:
Who pays you — and are they still in the game. Every edge has a counterparty: “someone” making a systematic mistake, or wearing a constraint they can’t take off. If the why is institutional unwinds into the Friday close, then count the unwinds. Measure the flow, not the profit on the flow. The flow is a characteristic — observable directly, daily, with no luck in it. When it thins, you know something is off.
The fills. Execution is the closest sensor you have to the mechanism. Fill rates against what the model expects. The adverse selection in your passive fills — what the market does in the seconds after it lets you in. A strategy whose fills start coming back different has changed, whatever the equity curve says.
The way it loses. Every mechanism has a signature failure. A mean-reverter should bleed in trends and get paid in chop. If it starts bleeding in chop, that is not variance — but a deafening siren. Losing right is evidence for the edge. Losing weird is evidence against it.
The size response. Push marginally more through it and watch what comes back — the impact, the fill quality at the increment. A strategy that scales too easily should worry you more than one that doesn’t. A similar problem to the one described in Front-loaded Value in Trading.
None of these are exotic. But the list is not exhaustive. Every strategy begs for a different set of metrics. All of them are observable daily, while a Sharpe ratio needs years to clear its own noise. A Sharpe 1 strategy produces one standard deviation of evidence per year — so you need roughly four years of live P&L before the returns alone separate your strategy from luck. That is the practical asymmetry: characteristics update fast and carry the why; outcomes update slowly and carry luck, noise and regime with them.
The evidence is all around us
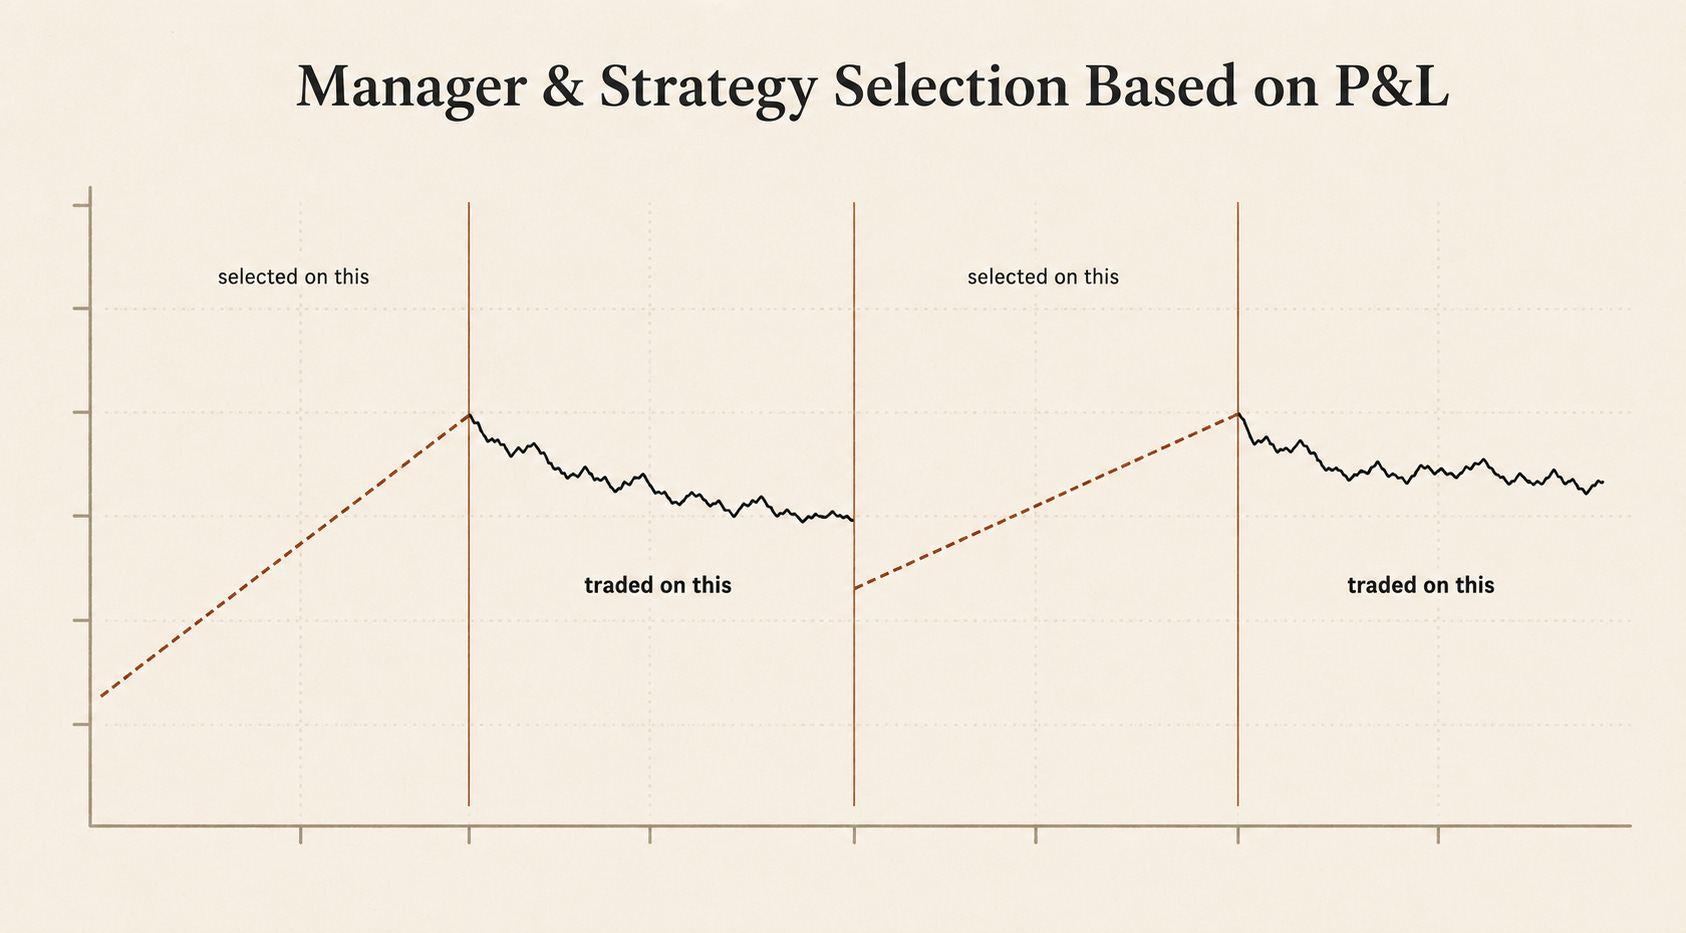
For decades, the largest allocators on earth hired the managers with the best three-year record and fired the worst. Goyal and Wahal tracked 3,400 plan sponsors doing it: the hired winners delivered nothing, and the fired losers rebounded2. And when academics published nearly a hundred market edges, McLean and Pontiff measured what happened next: the edges decayed. And they did so on a specific schedule3. The costlier the arbitrage was to execute, the longer the edge lived. The why predicted the when.
None of this makes returns useless. They are the final auditor. But this auditor files late — even a Sharpe 2 strategy needs a full year for some confidence, while the characteristics report every day. By the time the P&L confirms, the fills have known for months.
So…
… cover your equity curve with that tear-soaked tissue, and tell me what you still believe about the strategy. Whatever is left — the counterparty, the fills, the failure signature, the size it bears — that is the edge. If nothing is left, there was never anything there.
All of this assumes the returns you just covered were honest — a larger assumption than it sounds, as Klement showed at the first gate. Ahead is the last one: an edge and the way it survives production.
Thorp's formulation, quoted in Michael Mauboussin and Dan Callahan, "Who Is On the Other Side?", Counterpoint Global Insights, Morgan Stanley Investment Management (2024): an edge is returns that can be "logically explained in a way that is difficult to rebut." The second half — that knowing why it exists means knowing how it dies — is Mauboussin's reading of him. I've fused them because that's how it works in practice.
Amit Goyal and Sunil Wahal, "The Selection and Termination of Investment Management Firms by Plan Sponsors," Journal of Finance 63:4 (2008). About $700 billion of hiring decisions over a decade. The cruelest finding: when a sponsor fired one manager and hired another, keeping the fired one would have done just as well.
R. David McLean and Jeffrey Pontiff, "Does Academic Research Destroy Stock Return Predictability?", Journal of Finance 71:1 (2016). They tracked 97 published edges. After publication, returns dropped by more than half on average — but not evenly. The edges that were hard to trade away lasted longer. The mechanics set the decay timing.