
Front-loaded Value in Trading
The surprisingly consistent shape of a good signal

Good trades realize most of their value early in the holding period; bad trades do not. And early doesn’t scale with the holding period.
I have seen this across trading systems, in the widest range of assets and markets. The implications should make you pause. Pause. Repeat: bad trades have no shape. Good trades have a specific one. This affects everything — signal discovery, sizing, exits, and your ultimate PnL touchpoint: Executions.
A recap
In my previous post I took you through my Quant Room struggles to convey how executions rewrite strategy results completely, and how often I had to go through the same exercise. To gather the data, build the argument, confront the enthusiasm of a Strategy Builder with facts on the ground. The same facts.
It took dozens of cumulative samples before I started to wonder. The effect could not be explained by a combination of spread, commission, and slippage costs plus the core statistical mechanics. It wasn’t cost of execution. It was the shape of the value when the signal was the right one.
The shape
The first time I started to suspect was when I had to do the same exercise back-to-back-to-back, reviewing five very different strategies within two days. Momentum. European equities. Spot and FX futures with a carry component. A dollar-neutral US stocks portfolio. Medium-frequency day trading. They should have had nothing to do with each other. But my analyses from the previous four were still on my desk. The sheets were still on the Desktop. I could not unsee it. It was glaring at me.
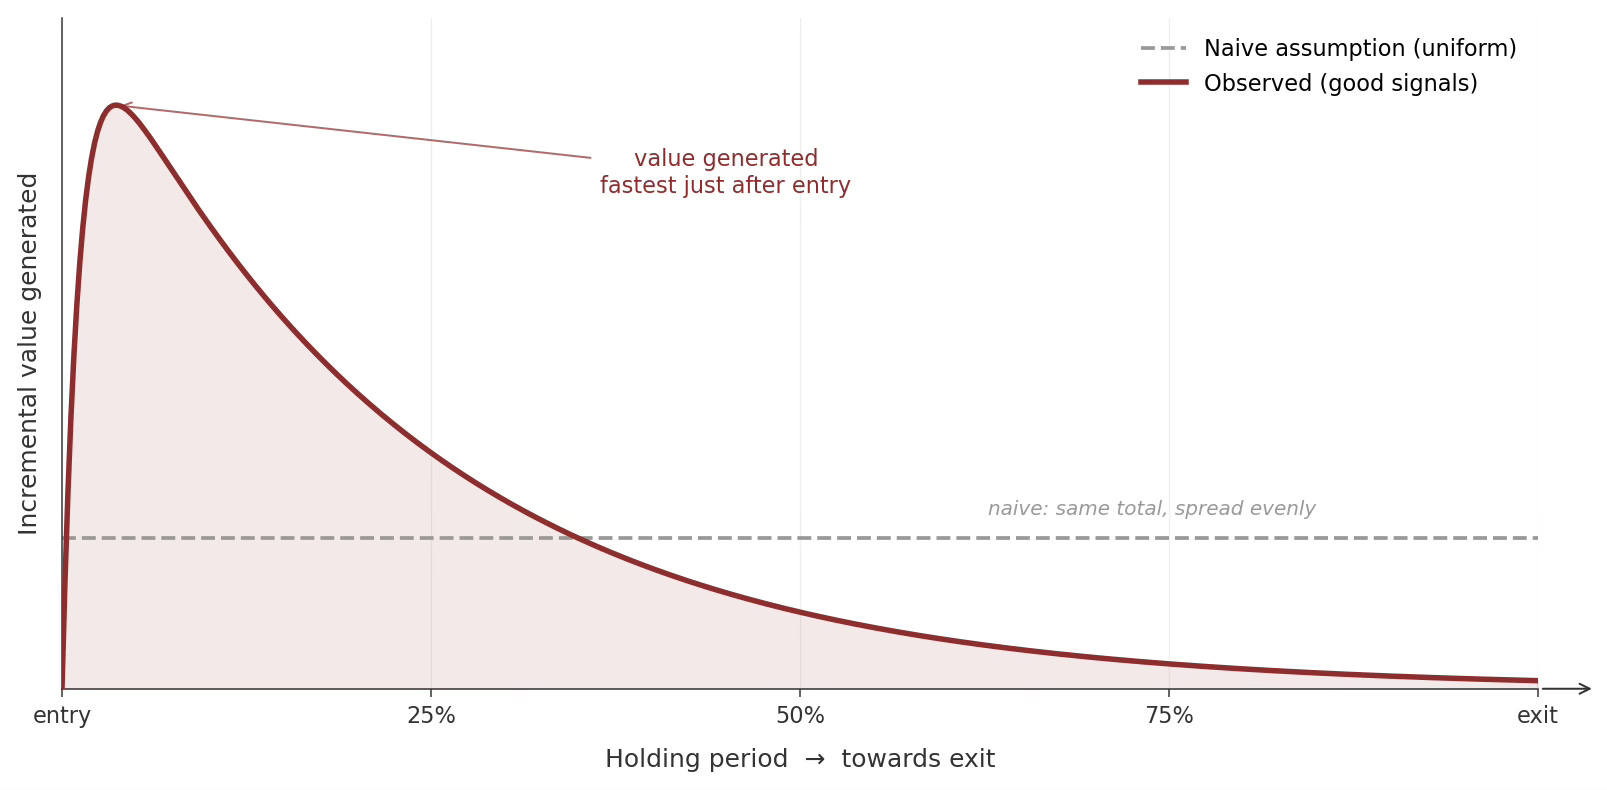
In good signals, the extractable value rises sharply from entry and is mostly realized in the first part of the holding period. The initial jump is sudden, followed by a plateau or modest decay.
This shape is the cumulative average across the system’s good trades, not any individual trade. Yet the same shape surfaced again and again across the systems, in their positive-outcome trades. Regime and asset class adjust the exact shape, but not the pattern.
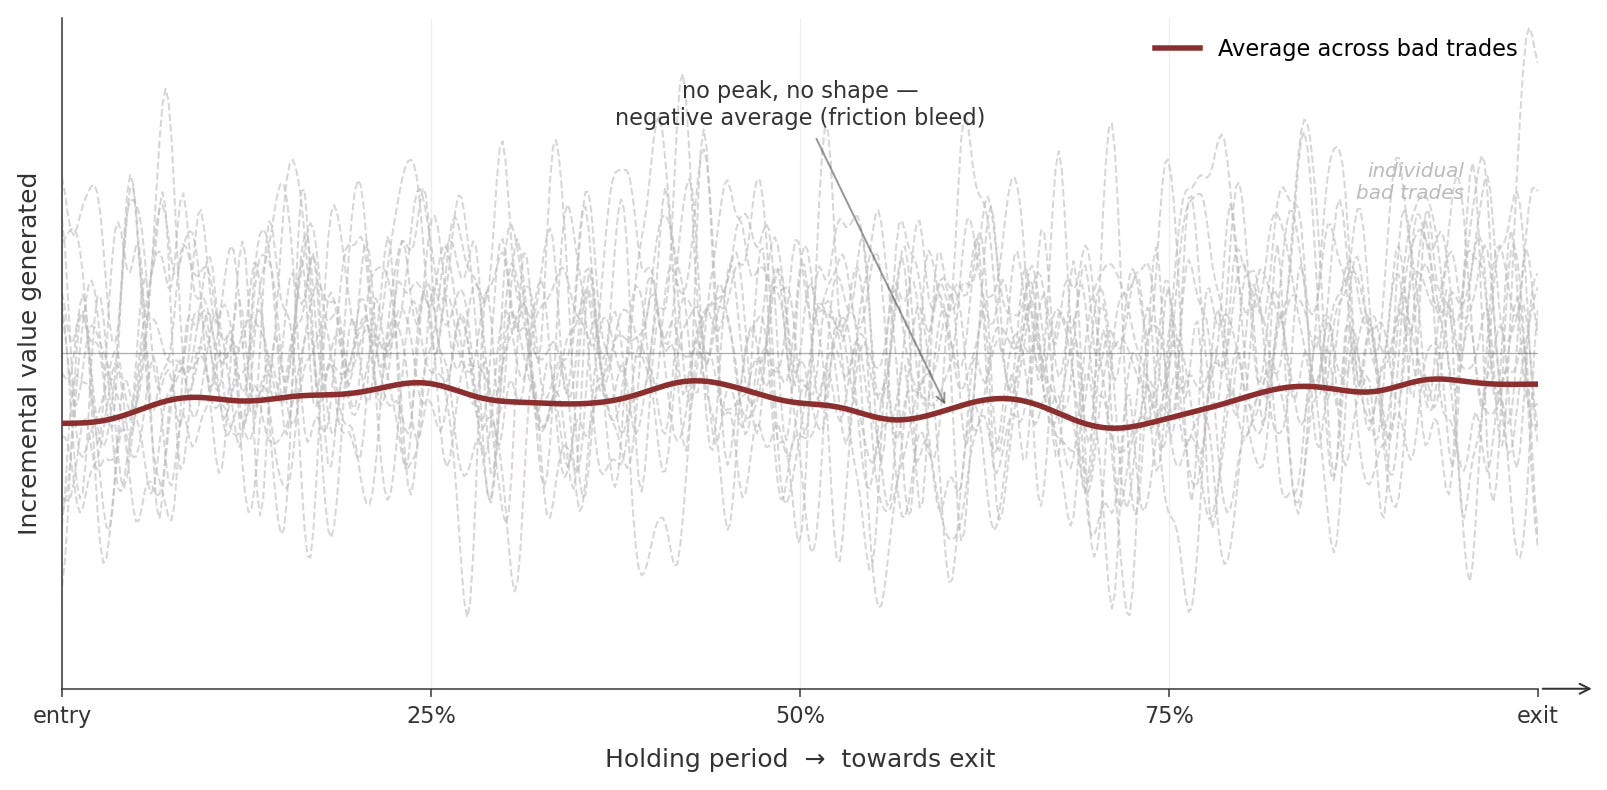
Bad trades, on the other hand, wander, bleed, spike, and revert. The more you accumulate, the more distinct the pattern appears compared to good signals.
So being front-loaded is a feature. It itself is a diagnostic about the quality of the trade.
One caveat: this is a post-event observation. The shape only emerges in retrospect, which limits its direct use in real-time signal generation. And to be clear about what I’m describing — the front-loading is disproportionate, not absolute. There is real value in the rest of the holding period; you can’t just cut early and assume the trade is done. What you can say is that the early window carries more of the value than its share of the holding period would suggest.
For a long time I had the observation without the implication. I knew the shape was there; I didn’t yet see what it meant for the rest of the strategy. That came later, and it came through analysis.
Why this matters for execution
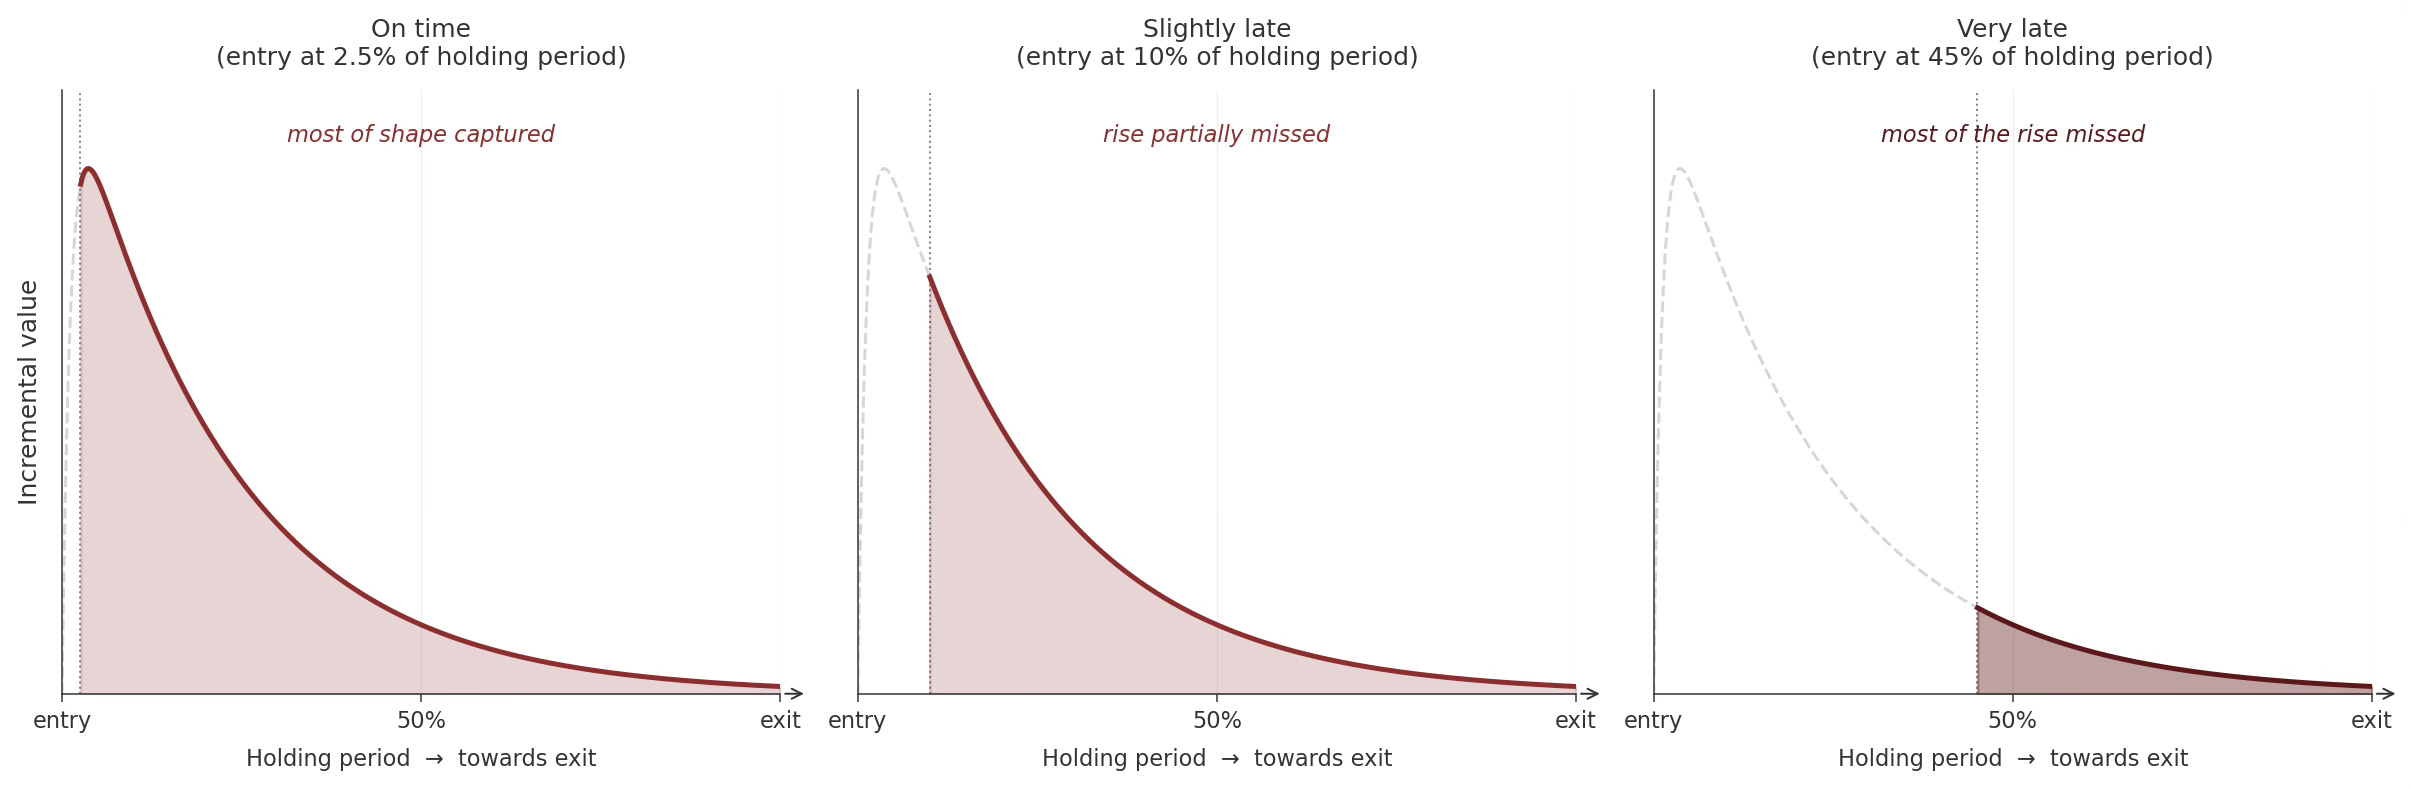
A two-day holding period trade may have most of its value accrue in the first few hours. But importantly, a disproportionate fraction of that will be packed into the very first minutes. Counterintuitive, but a logical consequence of the pattern described — the same disproportionality recurses within the early window itself.
Slippage and timing
This reframes what slippage actually is.
The traditional view treats it as a uniform tax on returns, a few basis points subtracted from the edge regardless of when in the trade they’re paid. Under the front-loaded shape, that view is wrong. Slippage is an edge-dampener, and the path it dampens is the good-signal path. The same basis points cost more when paid in the window where the value is concentrated.
Timing the entry becomes impactful for any strategy. A late entry isn’t just a delayed entry — it’s a different trade. The shape has begun without you. What is left to capture is the reduced part of the curve, while the fixed costs and the bad trades continue to drag you down at full strength.
This is why post #1’s claim that execution rewrites strategy results isn’t a marginal-cost story. It’s a shape-of-alpha story.
A note on what this isn’t
I want to clarify this has not been derived from first principles, nor is it a claim that this will consistently repeat for all asset classes in all markets, now and in the future. The mechanism — fast information assimilation, real edges being narrow in time, the difference between a real signal and one that’s mostly noise — is suggestive but underdetermined. These are observations, and empirical assertions.
So this is not an academic claim, even as the related literature has been documenting related shapes — particularly in how price impact decays after large orders — for decades. Even as analysis of informed and uninformed market participants has led to convergent conclusions (more on this later). What I would like to offer is the trader-side mirror of those observations, framed in a way practitioners can use.
For readers who want to go deeper into the underlying market mechanics from the academic perspective, here are the foundational papers and a few accessible follow-ups I would recommend (skip if short on time):
Recommended reading
Kyle, A. S. (1985). Continuous Auctions and Insider Trading. Econometrica, 53(6), 1315–1335. The foundational paper on how information enters prices.
Glosten, L. R., & Milgrom, P. R. (1985). Bid, Ask and Transaction Prices in a Specialist Market with Heterogeneously Informed Traders. Journal of Financial Economics, 14(1), 71–100. The companion 1985 paper, on adverse selection.
Hasbrouck, J. (1991). Measuring the Information Content of Stock Trades. Journal of Finance, 46(1), 179–207. Empirical foundation for permanent vs. transient impact.
Almgren, R., & Chriss, N. (2000). Optimal Execution of Portfolio Transactions. Journal of Risk, 3(2), 5–39. The execution-scheduling literature’s anchor.
Bouchaud, J.-P., Farmer, J. D., & Lillo, F. (2009). How Markets Slowly Digest Changes in Supply and Demand. In T. Hens & K. R. Schenk-Hoppé (Eds.), Handbook of Financial Markets: Dynamics and Evolution (pp. 57–160). North-Holland (Elsevier). Review of market impact and order flow dynamics.
The question
There is a question that we have been brushing against without pinning it. Why does this shape exist? Why does information get absorbed in a way that front-loads the value? Why front-loaded for good signals and not for bad ones?
The answer lives in the domain of market participants and information availability. Information becomes available to all or to a few in waves — waves that are difficult to conceal for long. It is the sudden availability of this information that underpins the effect we described so far.
The market participants who are in on it and those who only see the effects after the fact play a different role in price discovery.
This is exactly the topic of my next piece: the informed and uninformed traders, and how their interaction determines most of the market mechanics relevant to a trading system developer.