
The Momentum Monkey Null Hypothesis
Issue 1, Part I — Is the edge even real?
“Use anything but past returns!” It’s what I used to tell developers asking how to choose which strategies to keep, cut, or size up — a blunt instruction, meant to unsettle the easy assumption that what worked lately will keep working.
Harris takes the same suspicion one level down — not which strategies, but which stocks — and makes it rigorous. He builds a momentum strategy, then strips the momentum out: he randomizes the ranking that picks the stocks and the signal that times the entries. But he leaves the rest of the machinery intact. Each version is the same strategy with a coin flip where the edge used to be. Can real momentum beat its own randomized shadow?
The excerpt below runs to that result. To see where Harris lands — and what it means for every backtest that looks robust — read the original in full.
Data Mining, “Momentum Monkeys”, and Survivorship-Free Data
by Michael Harris · originally published at Price Action Lab
Monkeys can throw darts at stock quote pages of newspapers. Is long-only momentum better than the monkeys?
In his best-selling book A Random Walk Down Wall Street, Burton Malkiel claimed that a monkey wearing blinders and throwing darts at a newspaper’s financial pages could choose a portfolio that would perform just as well as one put together by financial analysts.
Momentum promised a challenge to the random walk hypothesis. There have been many claims, for and against momentum, but most in favor of the existence of a momentum edge. Other studies have shown that, although this edge existed in the past, it has diminished.
Quants do not rely on claims or the work of others; instead, they strive to replicate the findings, as there may be hidden assumptions or even errors. This requires access to survivorship-free stock data. In this study, we utilize Norgate Data’s S&P 500 index series, which encompass both past and current constituents. Access to survivorship-free data is required for a sound analysis of stock market momentum.
The next challenge in studying momentum is the proliferation of models. Here we rely on falsification of a general hypothesis: if a few simple models fail to demonstrate an edge, we can reject the hypothesis in general.
A higher-level problem is that the past represents only a particular path in the time domain, and data mining bias can be an issue. To deal with this problem, we used randomization for both the ranking score and the entry signals measuring momentum. Therefore, we looked at a distribution of results to determine whether momentum had a significant effect.
All backtests started on January 4, 1988, and end on October 22, 2024. We did not include commissions at this stage because we wanted to measure the pure edge, not to decide whether a strategy was suitable to trade.
First Model: Daily timeframe
At the end of every month, rank stocks according to 120-day rate-of-change and select the top 10 stocks to invest in the next month. The 1988–1999 backtest performance is below.
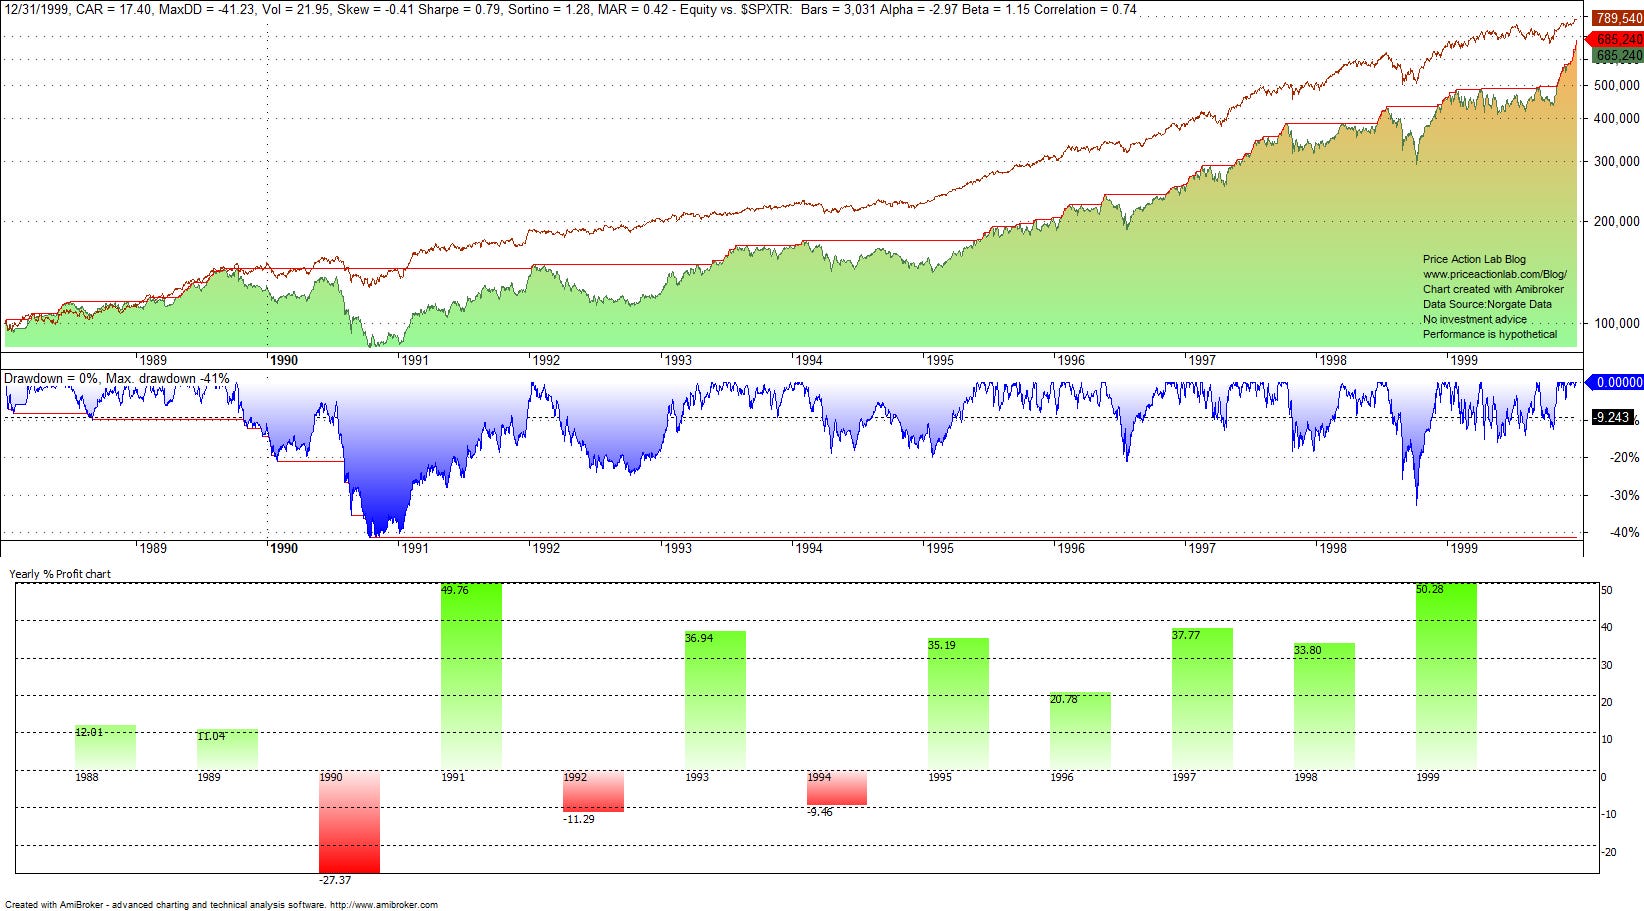
Although the model did not outperform the buy-and-hold of the S&P 500 total return (red line on the equity growth chart), nevertheless the results were impressive, with a 17.4% annualized return and a 0.79 Sharpe ratio. Below are the results from the start of 2000 to October 22, 2024.
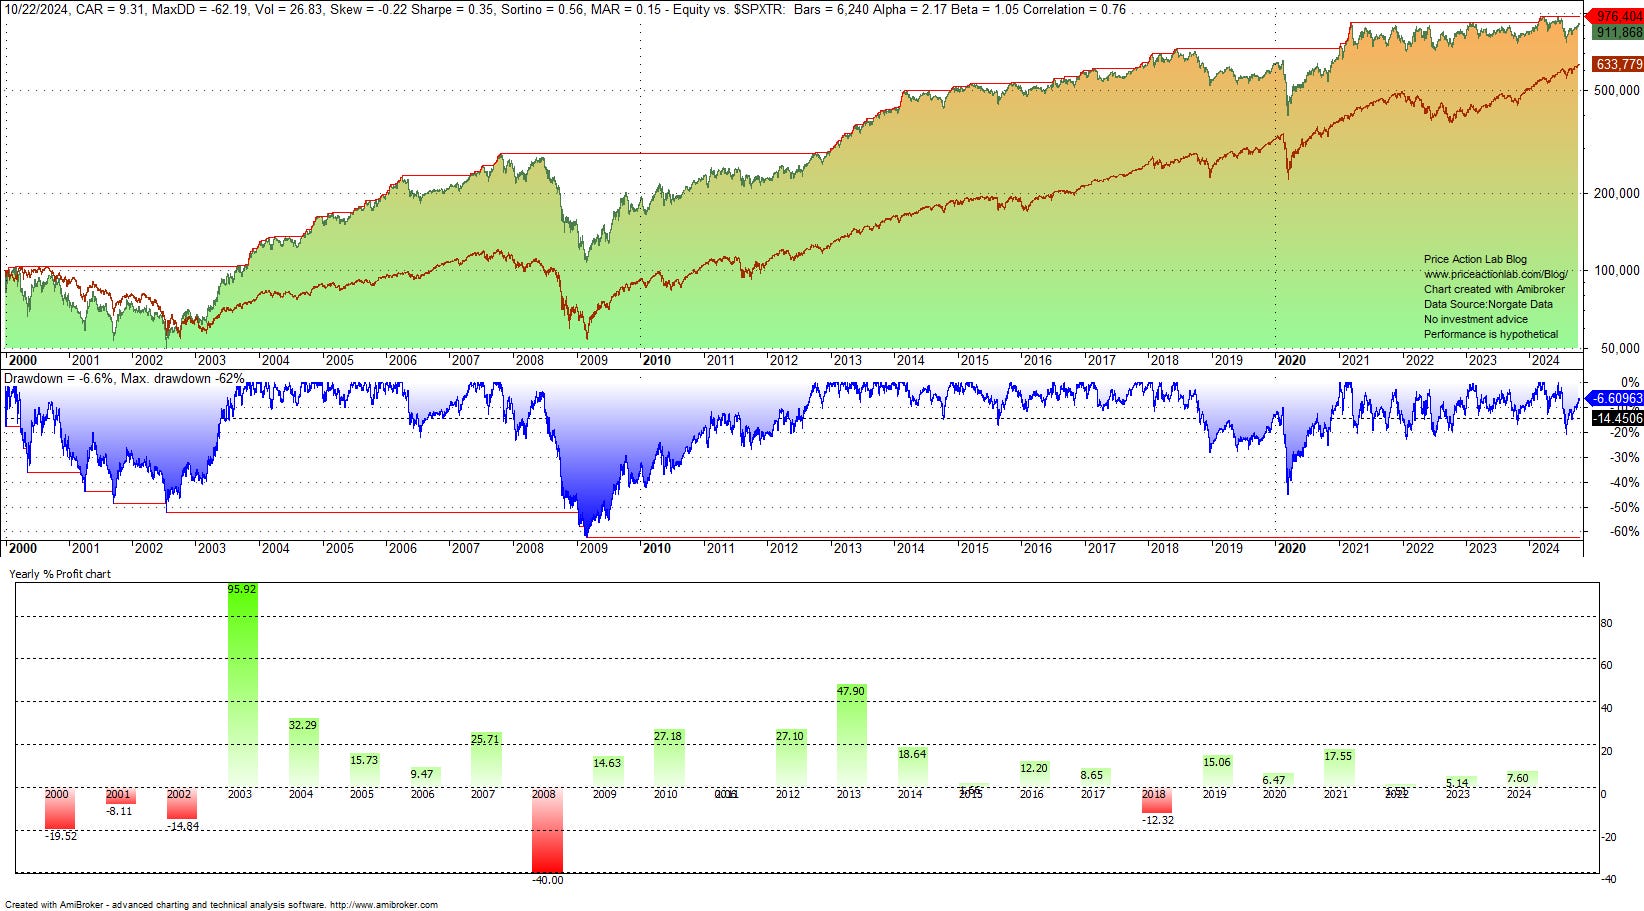
The model performed significantly better than buy-and-hold after the rebound from the dot-com bear market, but volatility in performance increased. The model outperformed buy and hold by a wide margin but at higher volatility and maximum drawdown, and the Sharpe ratio was only 0.35. In addition, the model has been flat after 2020, a phenomenon known as “momentum winter.”
Overall, from 1998 to 2024, the model underperformed in the 1990s but outperformed after the dot-com crash and subsequent financial crisis bear market, albeit with increased volatility. Based on summary statistics, this is how the model compares with the buy and hold strategy in the S&P 500 index.
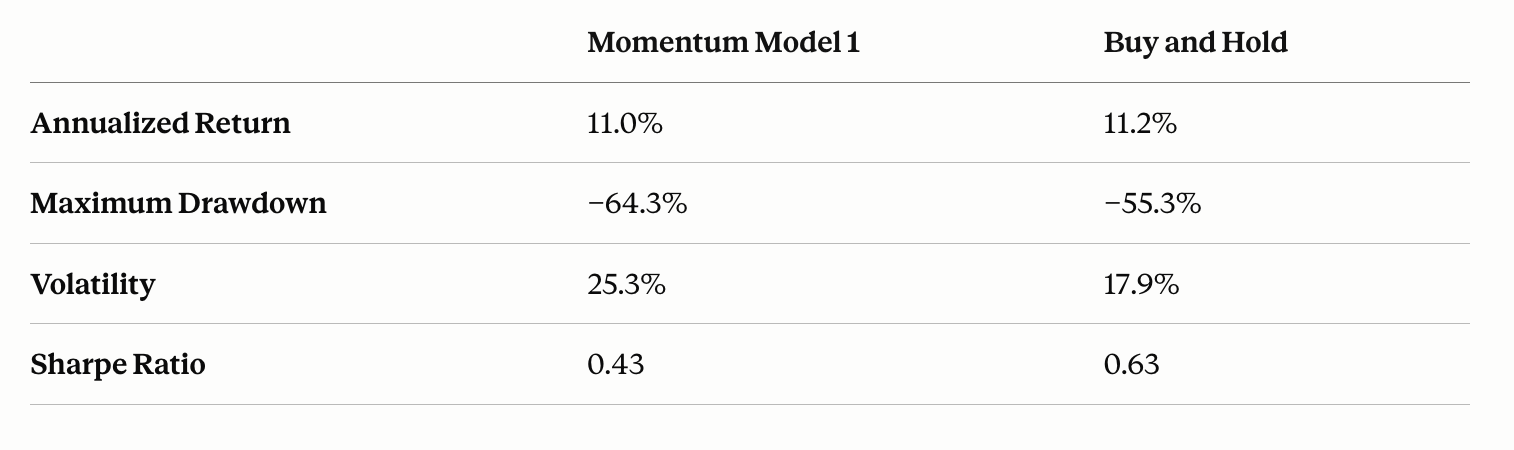
In the best case scenario, momentum performance (annualized return) has been either statistically indistinguishable from buy and hold or worse than buy and hold. On a risk-adjusted basis (using the Sharpe ratio), momentum has underperformed.
However, we have selected a 120-day lookback period for the rank function and tried a specific model (Model 1). Additionally, the index reconstitution only represents a specific path in the time domain; it could have varied under different market conditions. For this reason, we will randomize both the entry signals and the ranking function and, in effect, test a large number of “momentum monkeys” throwing darts to select 10 stocks. Below is the distribution of the annualized return of 500 “momentum monkeys.”
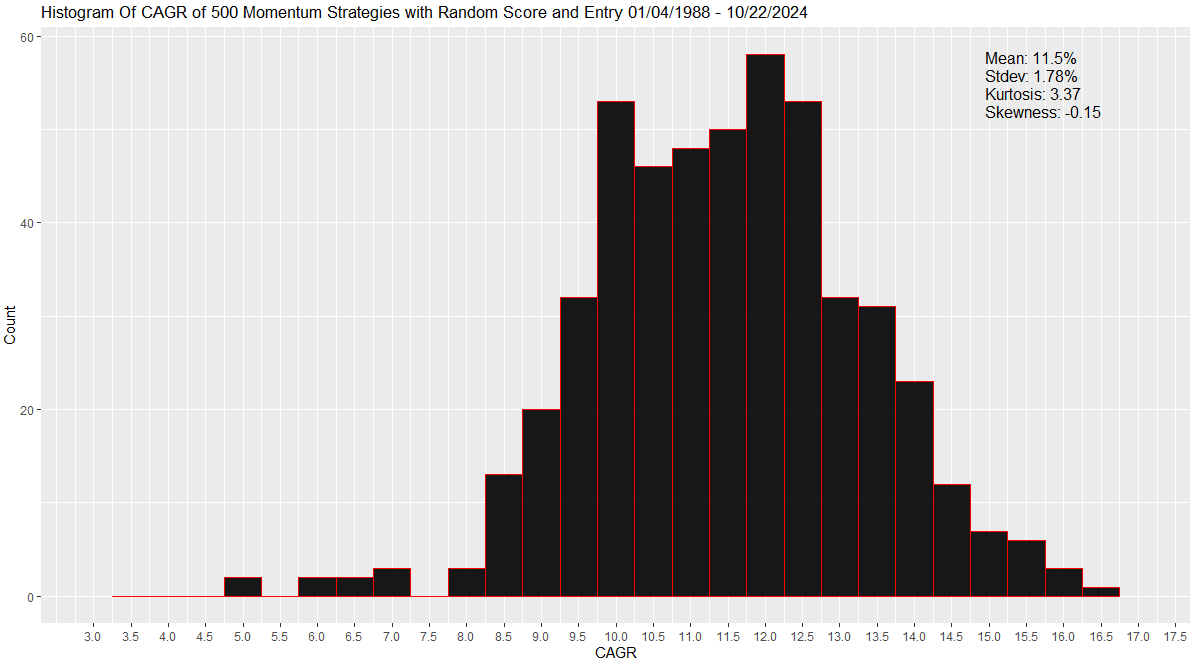
About 61% of the “momentum monkeys” had higher annualized returns than Model 1, and the average performance was 11.5%. This confirms the theory that, on average, monkeys throwing darts have outperformed momentum. Also note that there have been no losing monkeys.
That's where the excerpt stops. To see where Harris lands — and what it means for momentum's reputation as a 'robust' strategy — read the original in full.